



Skip to content
View NiklasJordan's full-sized avatar

Highlights

  • Pro

Organizations

@DisasterTechCrew @OpenSpaceData

Block or report NiklasJordan

Block user

Prevent this user from interacting with your repositories and sending you notifications. Learn more about blocking users.

You must be logged in to block users.

Content in all repositories owned by your account will be closed.
Maximum 250 characters. Please don’t include any personal information such as legal names or email addresses. This note will only be visible to you.
Report abuse

Contact GitHub support about this user’s behavior. Learn more about reporting abuse.

Report abuse
NiklasJordan/README.md

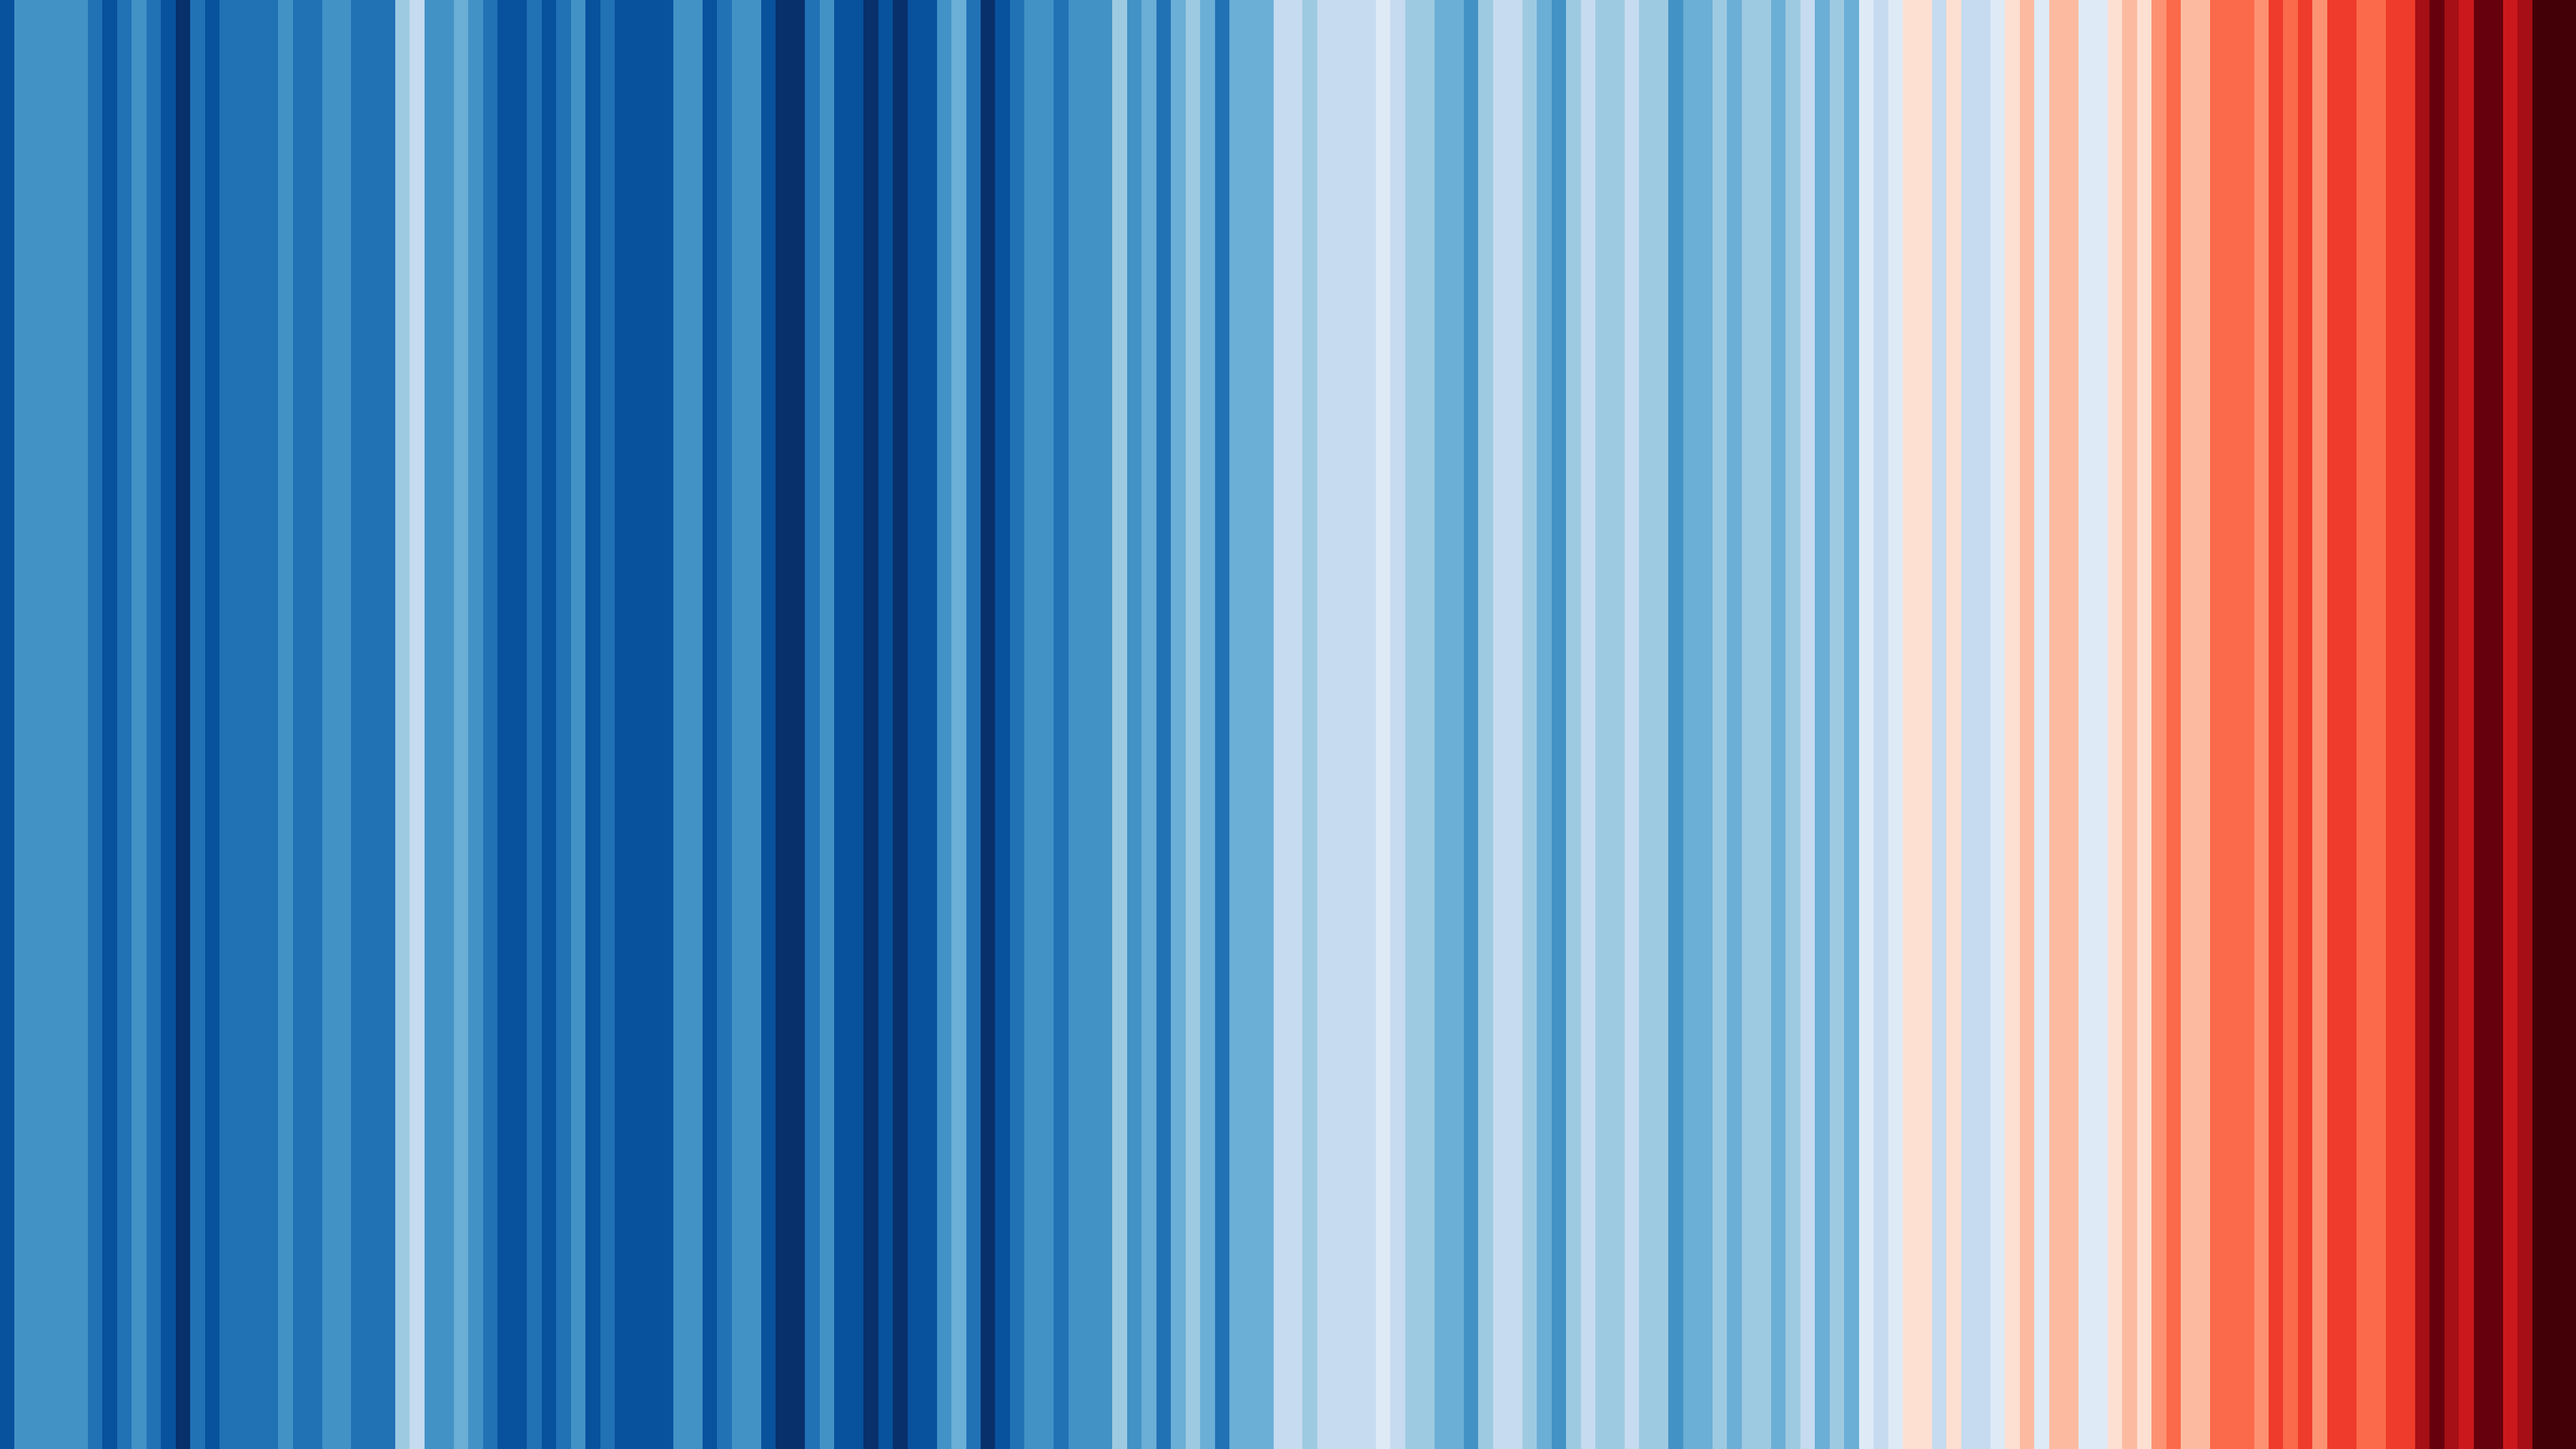
These β€˜warming stripe’ graphics are visual representations of the change in temperature as measured in each country over the past 100+ years. Each stripe or bar represents the temperature in that country averaged over a year. This stripes are based on global data from 1850 to 2024 and are created by Ed Hawkins.

Hej there, I'm Niklas πŸ‘‹

I’m a Geologist working on safer communities, based in Denmark πŸ‡©πŸ‡°. I analyse natural hazards and physical climate risks, from floods to storms, and communicate them so people can act.

🏒 What I'm building

  • geofare β†’ – my independent climate risk consultancy: physical climate risk assessment, spatial analysis and risk communication, with tools for emergency planners and climate adaptation teams.
  • FloodReady.dk β†’ – a free flood risk check for every Danish home (stormflod, skybrud, grundvand, vandlΓΈb), plus advice on how to adapt. Launching soon.
  • By day, I support users of EUMETSAT's data services (Data Store, EUMDAC, EUMETView) via Innoflair πŸ›°οΈ

🌱 Earlier & ongoing

  • With OpenSpaceData β†’ I founded an organisation on a mission to democratise satellite data through easy-to-use tools and education.
  • With DisasterTech β†’ I co-founded and led an international community of designers, developers, scientists and engineers building tools for people in crisis.

πŸ“£ What I believe

Better (flood) risk models alone won't save anyone: the last mile matters more than the last decimal. How risk is communicated decides whether people act. Read more in Stop Building Better Flood Models.

πŸ’¬ Ask me about

Flood risk 🌊, geohazards ⚠️, weather 🌦️, remote sensing πŸ›°οΈ, maps πŸ—ΊοΈ, risk communication 🚨, hydraulic modelling, stormwater management, open data, low-cost technology, human rights and tech ethics. Yep, lots of interests. Oh, and one more thing: I love rough weather! β›ˆοΈ

Ask me anything in my AMA repo.

🌎 Find me around the web

Pinned Loading

  1. ama ama Public

    Forked from holman/ama

    Ask @NiklasJordan anything!

  2. meteoalarm meteoalarm Public

    Python package for accessing and filtering weather warnings from MeteoAlarm's CAP (Common Alerting Protocol) feeds. This library provides easy access to weather warnings across European countries t…

    Python 12 4

  3. geofaredk/vindy geofaredk/vindy Public

    An interactive weather map for Denmark, built only on official DMI forecasts.

    JavaScript 1

  4. DMI-Climate-Value-CLI DMI-Climate-Value-CLI Public

    Python 1